Homelab dashboard

ComExe.
A calm dashboard for a TrueNAS homelab.
Work in progressStill being built, so features, screenshots and this page will change.
- Status
- In progress
- Stack
- Last update
- Oct 2026
- Source
- Source on GitHub
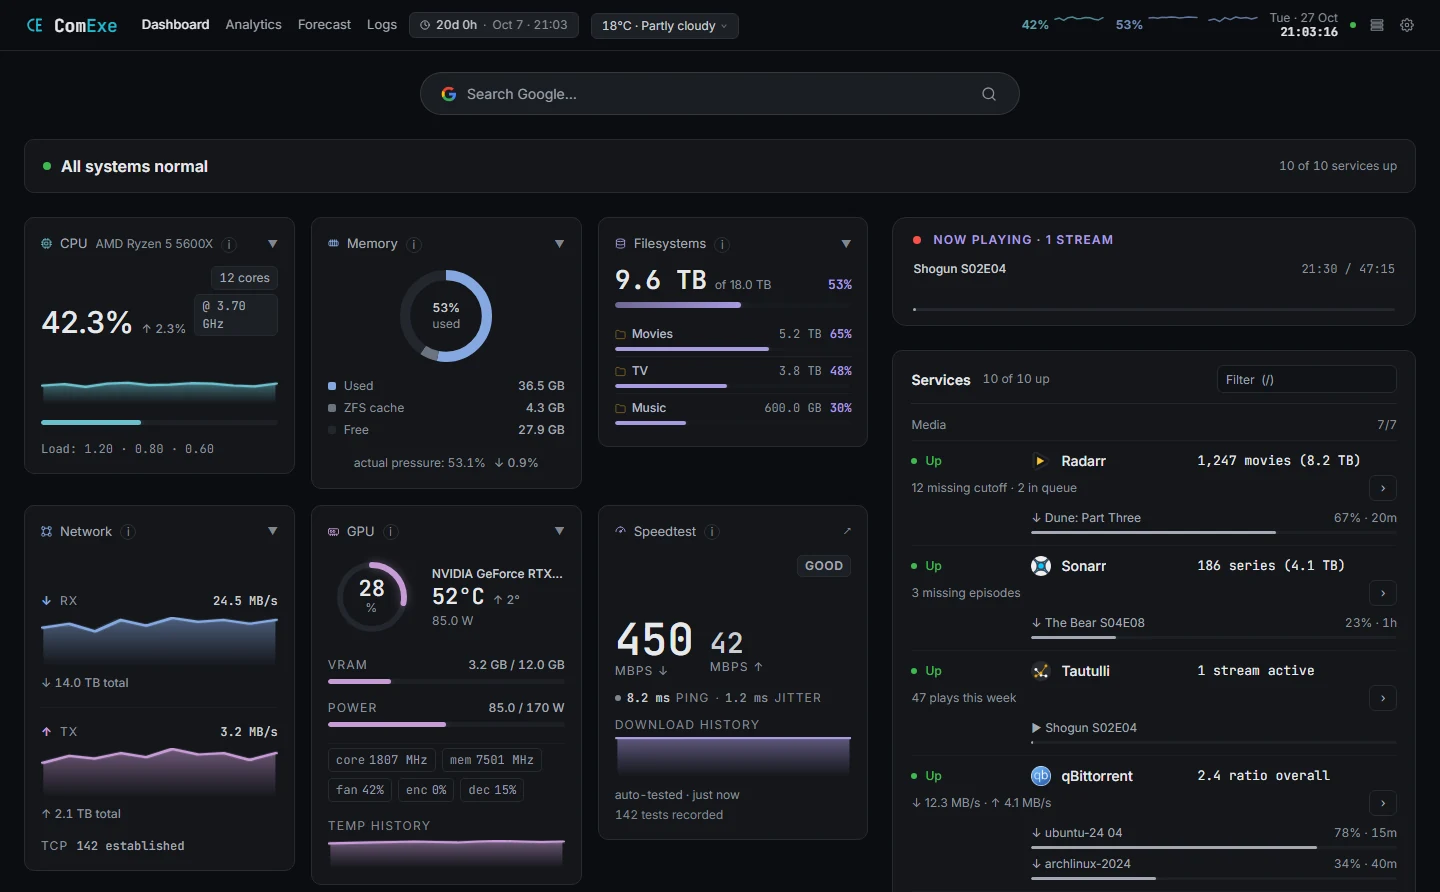
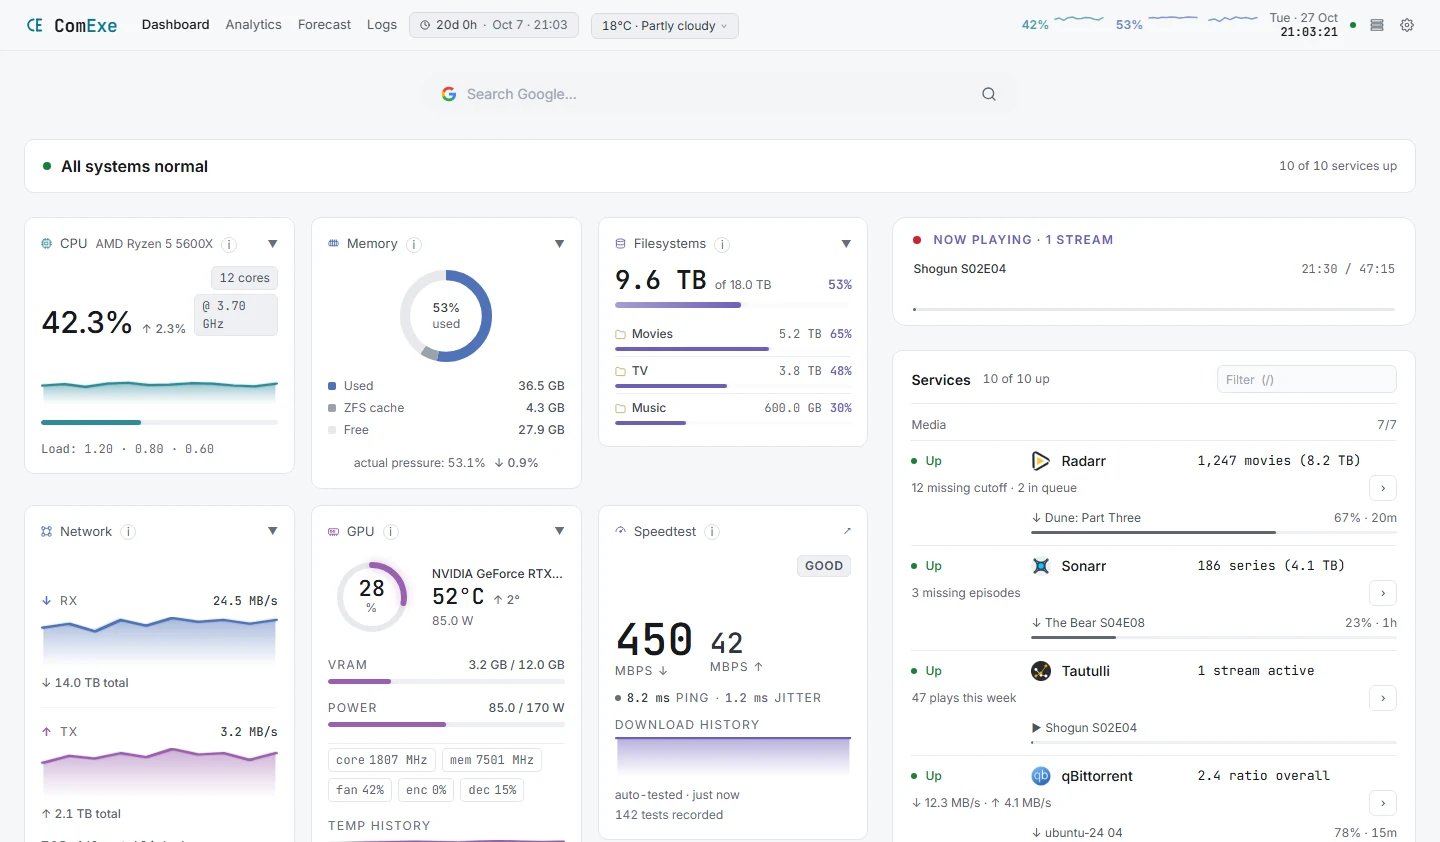
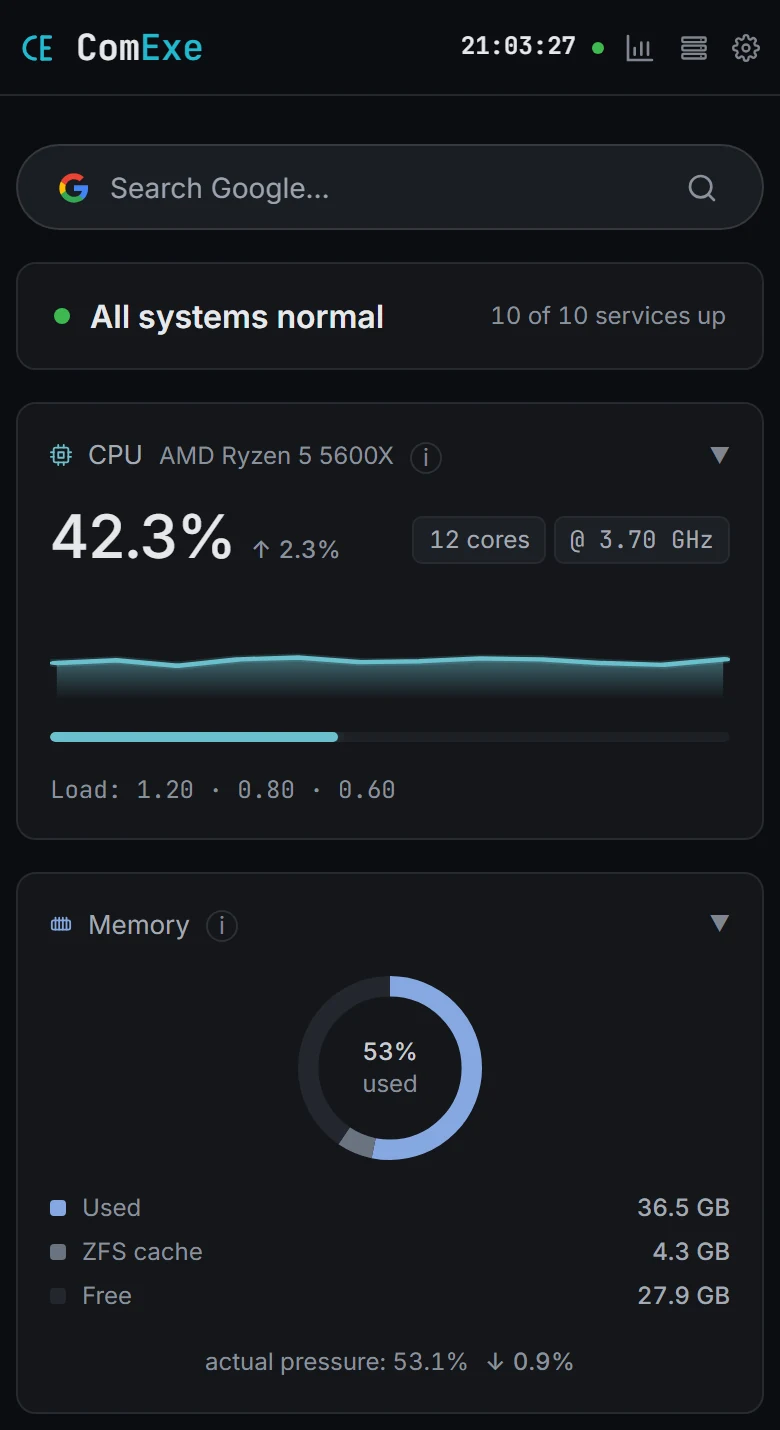
Live Prometheus metrics and the health of every media and infrastructure service on one page, with alerts and history — set up from a web wizard, no database.
Why I built it
A homelab with a media stack ends up with a tab for every service. I wanted one page that answers the only question that matters at a glance — is anything wrong? — and only uses colour when something is.
What it does
- Status at a glance — a summary line reads “All systems normal”, or lists exactly what needs attention: a crossed threshold, a service that’s down or rejecting its credentials, health errors, stale data.
- Metrics — CPU, ZFS-aware memory, pools and datasets, network, GPU and disk health from Prometheus, with history from an hour to a week.
- Services in one list — Radarr, Sonarr, Bazarr, Tautulli, qBittorrent, Overseerr, Prowlarr, Pi-hole, Nginx Proxy Manager and Uptime Kuma, sorted so problems come first.
- Alerts with no tab open — a background collector checks thresholds and records history around the clock, and sends webhooks to Discord, Slack, ntfy or any JSON endpoint, with throttling and quiet hours.
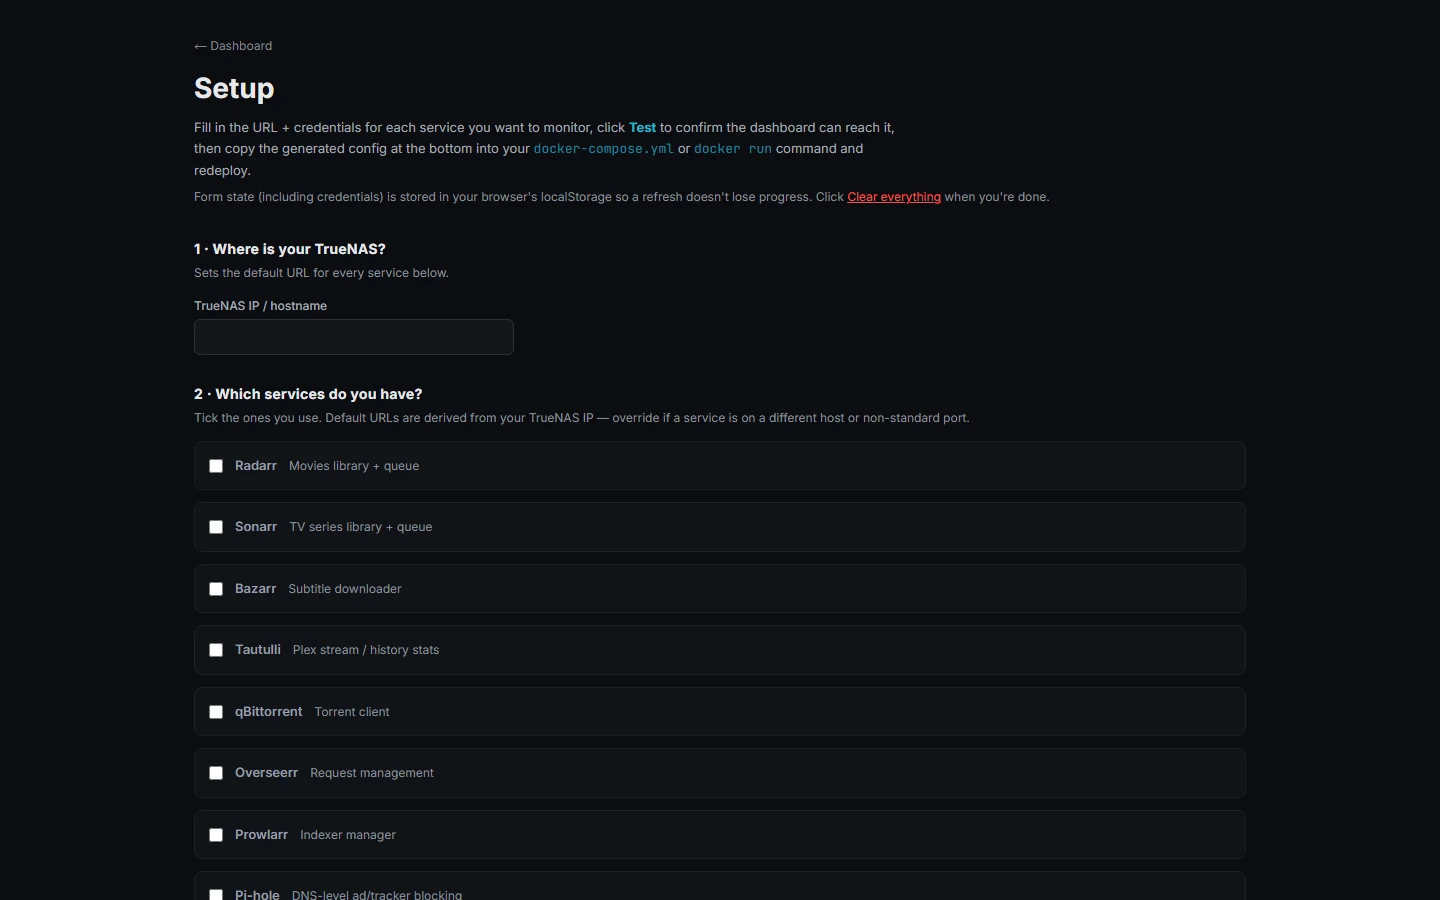
- Set up in the browser — a wizard tests each service’s credentials live and applies the settings within seconds. Saved keys are never sent back to the browser.
Engineering decisions
- Gentle on the homelab — the first version polled every 3 seconds and crashed the *arr containers. Now one server-sent-events stream feeds the page, with connection caps, a circuit breaker and minimum intervals per service.
- Server-side only — the browser never calls the services directly, so credentials stay on the server.
- No chart library — every sparkline, gauge and chart is hand-written SVG or Canvas.
- No database — settings are one file on a mounted volume, and it ships as a multi-arch Docker image.
Status
ComExe runs on a home network rather than on the server behind this site, so there’s no live status for it here.
More screenshots