Server monitoring

Othoni.
Server monitoring in one process and one file.
- Status
- Active
- Live
uptime checks passing Live figure unavailable right now
- Stack
- Licence
- MIT
- Last update
- Oct 2026
- Source
- Source on GitHub
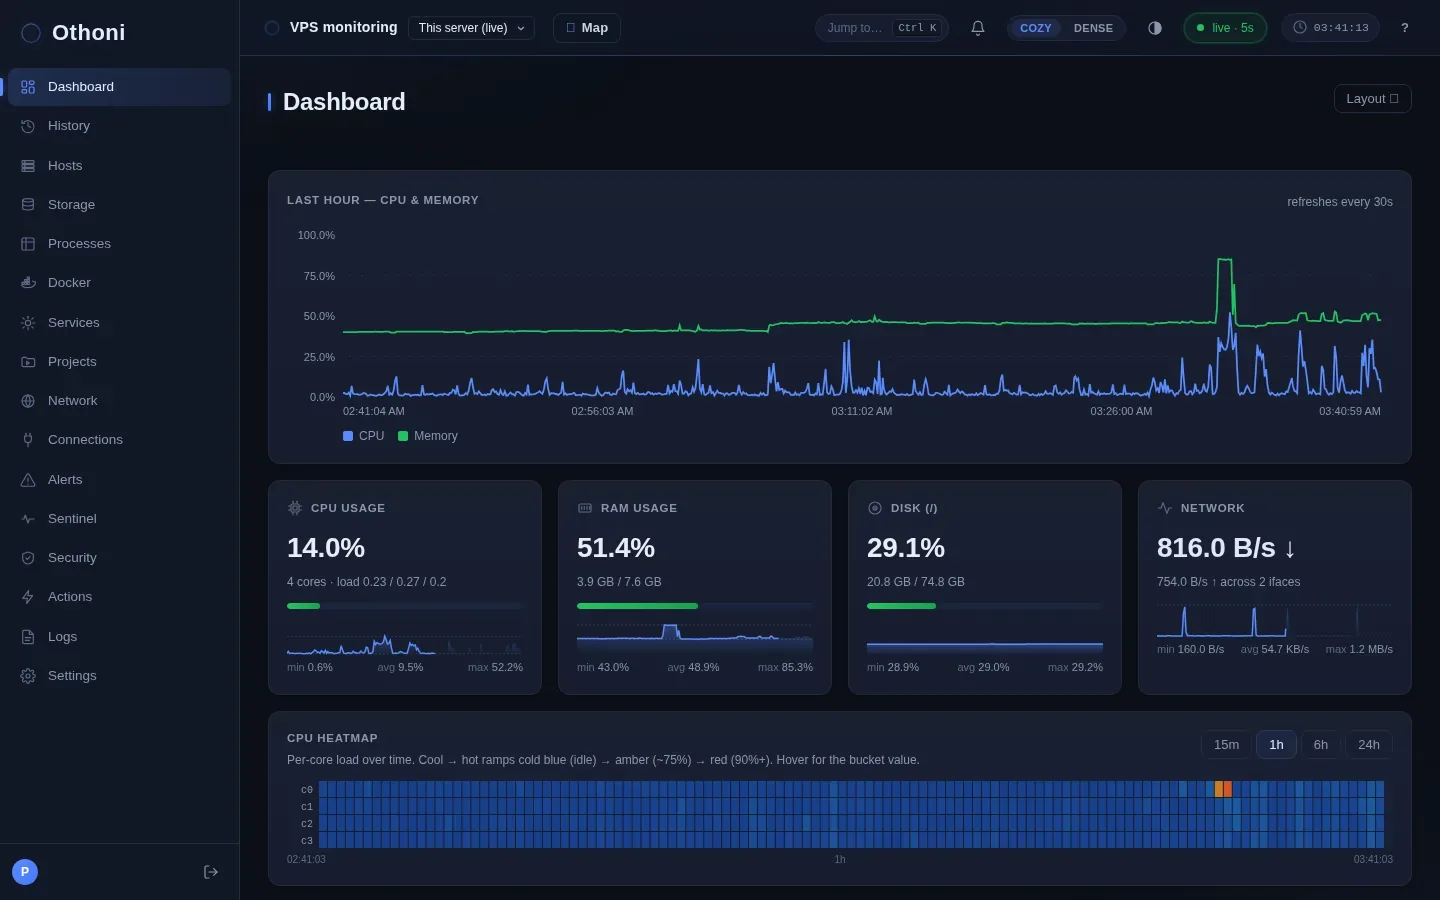
Live metrics, history, alerts and uptime, certificate, DNS and heartbeat checks — one Node process and one SQLite file, no agents, no chart libraries.
Why I built it
Most monitoring stacks want an agent, a time-series database and a charting server before they show you a single graph. I wanted to drop one thing on a server and have a dashboard.
What it does
- Live system view — CPU per core, memory, disks, disk I/O, network, processes, Docker containers and systemd services.
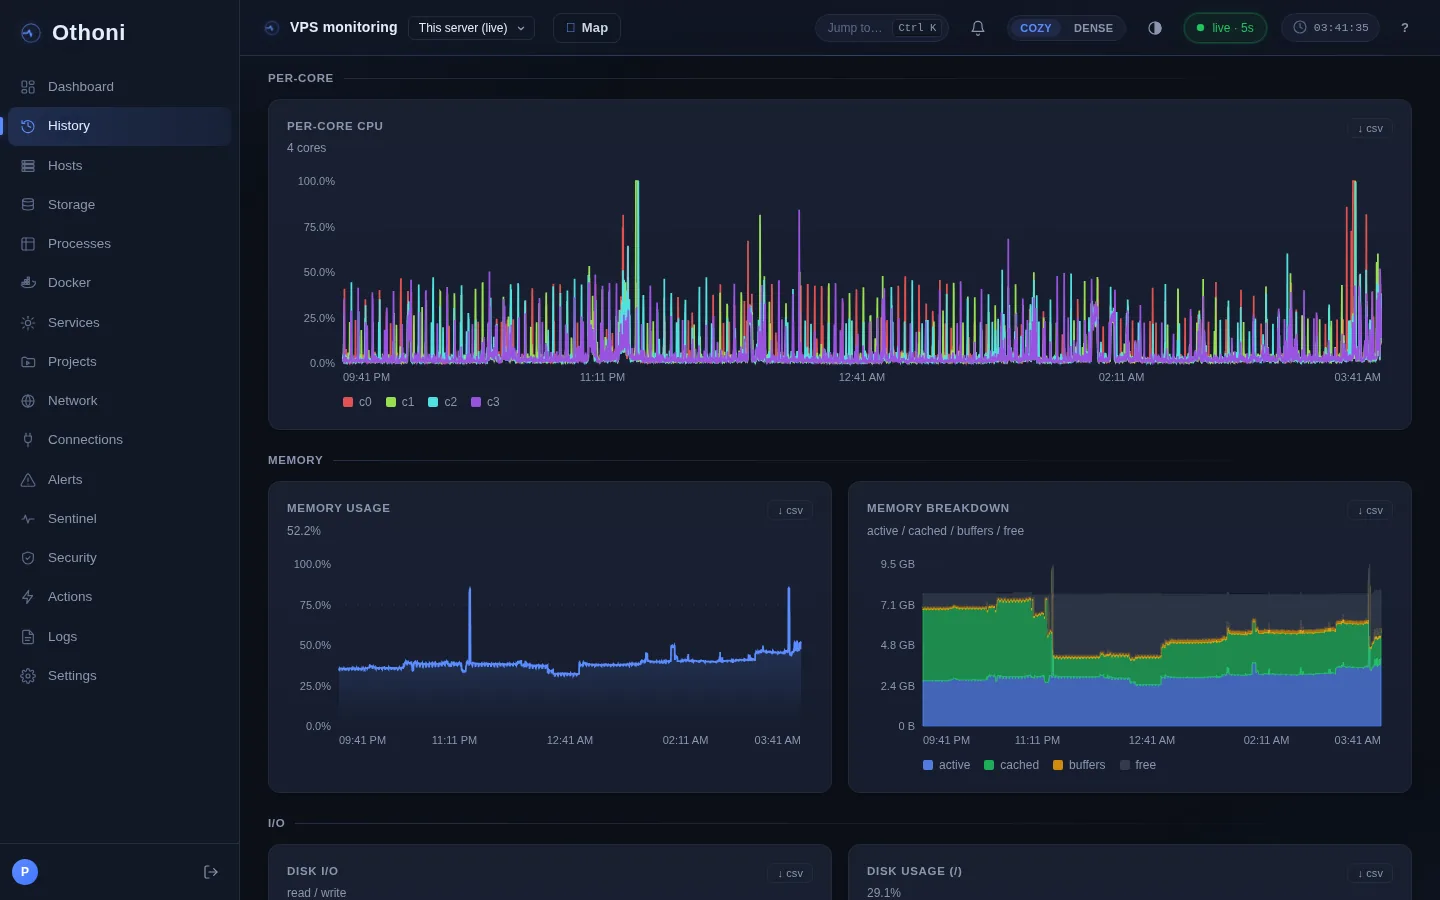
- History — 24 hours of metrics with zoomable charts and CSV export.
- Alerts — threshold rules and checks that notify Discord, Slack, Teams, email, PagerDuty or Opsgenie.
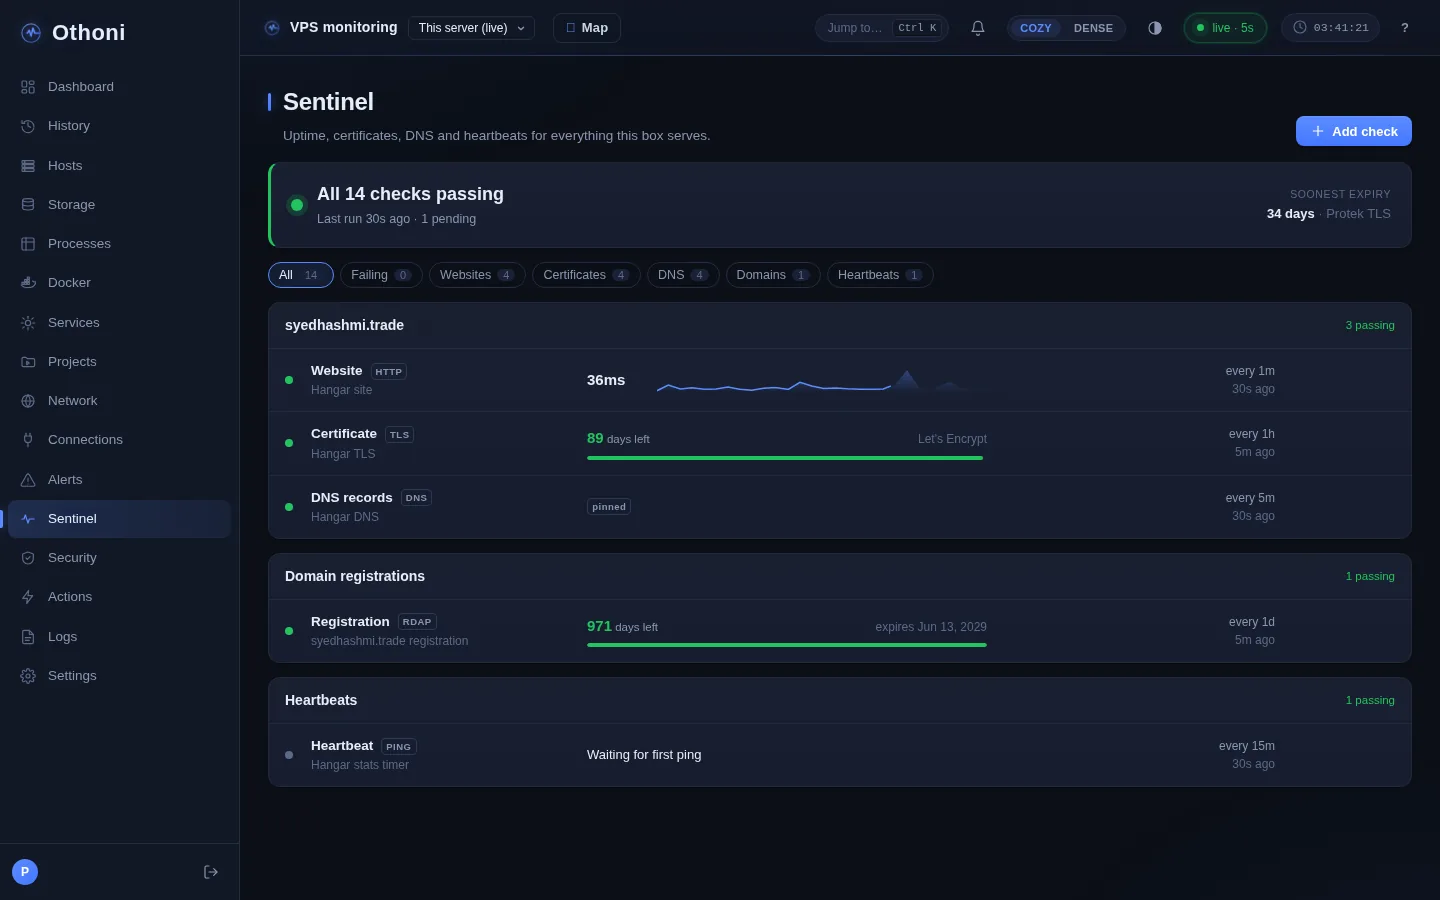
- Sentinel checks — website uptime, TLS certificate and domain expiry, DNS record changes, and heartbeats that catch cron jobs that stop running.
- Fleet view — several servers on one dashboard through federation, plus a security audit with one-click fixes.
Engineering decisions
- One process, one file — a single Node process and one SQLite file: no agents, no time-series database, no separate charting server.
- Hand-written SVG charts — the history charts are drawn without a chart library.
More screenshots